
Stock Information & Shareholder Returns | Takeda Investor Relations

Stock Information & Shareholder Returns
Stock Quotes & Chart
Shareholder Returns and Maximizing Corporate Value
Enhancing Shareholder Value and Capital Efficiency
Takeda’s purpose is to contribute to better health for people and a brighter future for the world. Guided by our commitment to patients, our people, and the planet, and grounded in our values, we pursue our vision to discover and deliver life-transforming treatments and long-term shareholder value.
Our R&D is focused on translating science into highly innovative medicines that can transform the lives of patients. We believe that the primary source of our enterprise value and sustainable growth is the ability to continuously deliver innovative medicines, made possible through investments in tangible and intangible assets, including the human capital that underpins innovation and the infrastructure that ensures the rapid and stable supply of high-quality medicines.
Developing new medicines is a long-term endeavor requiring significant financial investment. In all resource allocation and investment decisions, including those for R&D, we always ensure that expected returns exceed the cost of capital with the goal of maximizing return on investment. We also aim to enhance efficiencies and improve profitability by pursuing operational excellence and leveraging data and digital technologies.
To enhance enterprise value, we strive to maintain optimal cost of capital by managing our balance sheet while leveraging external capital and providing timely and transparent disclosures. Within the Global Finance organization, dedicated IR teams based in Japan and the U.S. work alongside senior management to drive strategic and ongoing IR activities.
The Takeda Executive Team (TET) and the Board of Directors regularly review our broad portfolio across therapeutic areas and business units as well as the progress of R&D programs. The TET and the Board of Directors also regularly analyze and evaluate capital efficiency and profitability at the enterprise level using various financial metrics, including Return on Equity (ROE) and Return on Invested Capital (ROIC).
Capital Allocation Policy: Commitment to Growth and Shareholder Returns
Guided by our vision to discover and deliver life-transforming treatments, and supported by our balance sheet (maintaining solid investment grade credit ratings; targeting 2x adjusted net debt to adjusted EBITDA ratio), we will allocate capital to deliver sustainable value to patients and attractive returns to our shareholders.
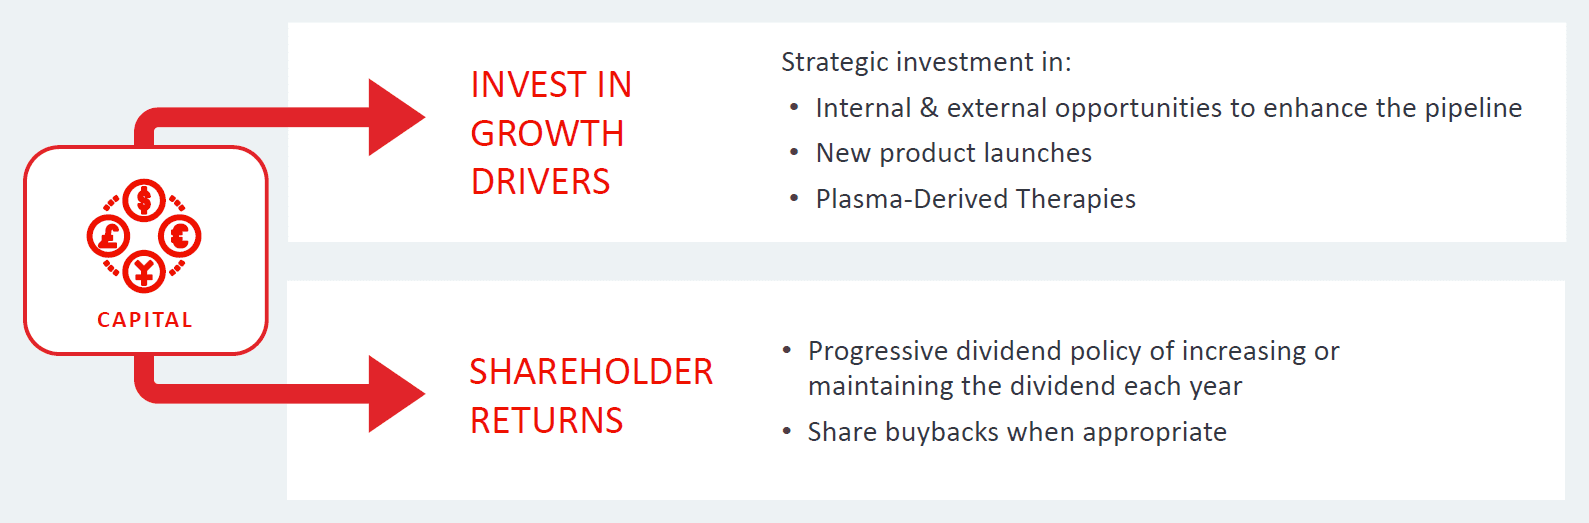
Takeda's policy in the allocation of capital is as follows:
- Invest in growth drivers; and
- Shareholder returns.
With respect to "Invest in growth drivers", Takeda makes strategic investments in internal and external opportunities to enhance its pipeline, new product launches, and plasma-derived therapies. With regard to "Shareholder returns", Takeda has adopted a progressive dividend policy of increasing or maintaining the annual dividend per share each year, alongside share buybacks when appropriate.
Dividends Overview
Shareholder Returns and Dividends
Takeda has adopted a progressive dividend policy of increasing or maintaining the annual dividend per share each year. In addition, Takeda may engage in the acquisition of its own shares when appropriate, including to enhance capital efficiency and improve shareholder returns.
Takeda distributes dividends twice a year. In FY2026, Takeda intends to return cash to shareholders with an annual dividend of 204 yen per ordinary share, consisting of interim and fiscal year-end dividends of 102 yen per share.
Important Dates
Interim Dividends
Record Date | End of the second fiscal quarter, September 30 |
Ex-Dividend Date | One business day prior to the Record Date |
Dividend Approval Date | Board meeting prior to the Q2 Earnings Announcement (around late October) |
Approval will be stated within the Q2 Financial Statements (Tokyo Stock Exchange Filing) found here | |
Payment Timing | By mid-December |
Year End Dividend
Record Date | End of the fiscal year, March 31 |
Ex-Dividend Date | One business day prior to the Record Date |
Dividend Approval Date | Annual Shareholders Meeting (around late June) |
Approval will be stated within the Notice of Resolutions at Shareholders Meeting found here | |
Payment Timing | By mid-July |
For American Depositary Share (ADS) holders
Takeda American Depositary Shares (ADS) are listed on the NYSE.
Please note that 2 ADSs represent 1 ordinary share, and therefore the ADS dividend amount is ½ of the ordinary share amount. The final US Dollar dividend amount will only become known at the timing of payment when our ADS Depositary, the Bank of New York Mellon, exchanges the dividends from Japanese Yen to US Dollars for ADS holders. The final USD amount will be stated on the Bank of New York Mellon’s website.
Registered holders can reach out to Bank of New York Mellon’s transfer agent, CPU (Computershare) for additional information, whereas the beneficial ADS holders holding through their brokers should reach out to their respective brokers for more information. [email protected]
In North America: 888-796-2480
International: +1 201-680-6825
Registered holders can also reach out to CPU via the following:
Regular mail
BNY Mellon P.O. Box 43006 Providence RI 02940-3078 United States of America
Courier / overnight / certified / registered delivery
BNY Mellon 150 Royall Street - Suite 101 Canton, MA 02021 United States of America
Shareholder Information
Stock Index (As of June 30, 2026)
Number of shareholders: 614,174
Number of shares: 1,591,273,909
| Type | FY2022 | FY2023 | FY2024 | FY2025 | Quarter1 FY2026 |
|---|---|---|---|---|---|
| Japanese National and Local Government | 1 people 0 thousand shares 0.00% | 1 people 0 thousand shares 0.00% | 1 people 0 thousand shares 0.00% | 2 people 1 thousand shares 0.00% | 2 people 1 thousand shares 0.00% |
| Japanese Financial Institutions | 266 people 443,503 thousand shares 28.03% | 263 people 437,984 thousand shares 27.68% | 254 people 461,247 thousand shares 28.99% | 229 people 423,529 thousand shares 26.62% | 227 people 414,377 thousand shares 26.04% |
| Japanese Financial Instruments Business Operators | 60 people 95,220 thousand shares 6.02% | 67 people 93,862 thousand shares 5.93% | 60 people 116,242 thousand shares 7.31% | 51 people 100,946 thousand shares 6.34% | 48 people 9,213 thousand shares 0.58% |
| Japanese Other Corporations | 3,335 people 48,431 thousand shares 3.06% | 3,681 people 50,700 thousand shares 3.20% | 3,538 people 49,223 thousand shares 3.09% | 3,296 people 47,308 thousand shares 2.97% | 3,189 people 43,838 thousand shares 2.75% |
| Foreign Shareholders | 2,027 people 602,577 thousand shares 38.08% | 2,276 people 598,823 thousand shares 37.84% | 2,370 people 573,534 thousand shares 36.05% | 2,566 people 667,904 thousand shares 41.97% | 2,628 people 779,047 thousand shares 48.96% |
| Japanese Individuals and Others | 603,893 people 371,098 thousand shares 23.45% | 646,485 people 393,534 thousand shares 24.87% | 648,557 people 378,970 thousand shares 23.82% | 617,091 people 345,251 thousand shares 21.70% | 608,079 people 338,507 thousand shares 21.27% |
| Treasury Shares | 1 people 21,467 thousand shares 1.36% | 1 people 7,514 thousand shares 0.47% | 1 people 11,734 thousand shares 0.74% | 1 people 6,290 thousand shares 0.40% | 1 people 6,291 thousand shares 0.40% |
| Total | 609,583 people 1,582,296 thousand shares | 652,774 people 1,582,419 thousand shares | 654,781 people 1,590,950 thousand shares | 623,236 people 1,591,229 thousand shares | 614,174 people 1,591,274 thousand shares |
Principal Shareholders
| Name of Shareholders | Number of shares held (thousands) | Percentage of total shares (%) |
|---|---|---|
| The Master Trust Bank of Japan, Ltd. (Trust account) | 264,947 | 16.72 |
| Custody Bank of Japan, Ltd. (Trust account) | 79,637 | 5.02 |
| The Bank of New York Mellon as depositary bank for depositary receipt holders | 79,066 | 4.99 |
| The Chase Manhattan Bank, N.A. London Secs Lending Omnibus Account | 51,354 | 3.24 |
| State Street Bank And Trust Company 505001 | 41,025 | 2.59 |
| JP Morgan Chase Bank 385781 | 23,548 | 1.49 |
| Government of Norway | 20,688 | 1.31 |
| Takeda Science Foundation | 17,912 | 1.13 |
| BNYM AS AGT/CLTS 10 PERCENT | 17,484 | 1.10 |
| JP Morgan Chase Bank 385642 | 15,583 | 0.98 |
Credit Rating
(As of March 31, 2026)
| Institution | Rating |
| Moody's | Baa1 |
| Standard & Poor's (S&P) | BBB+ |
| Rating and Investment Information, Inc. (R&I) | A+ |
| Japan Credit Rating Agency, Ltd. | AA- |
Administrative procedures for shares
For American Depositary Shares (ADS) Holders
ADS Depositary Bank: The Bank of New York Mellon (Computershare)
ADS Holders can contact The Bank of New York Mellon's transfer agent Computershare via telephone, in writing or email as follows:
Telephone
Toll Free Number within the United States: 1-888-796-2480
Number for International Calls: +1-201-680-6825
Regular mail
BNY Mellon P.O. Box 43006 Providence RI 02940-3078 United States of America
Courier / overnight / certified / registered delivery
BNY Mellon 150 Royall Street - Suite 101 Canton, MA 02021 United States of America
Email: [email protected]
Website: http://www.adrbnymellon.com/
For Former Shire Shareholders (Ordinary Shares) who have not made an election in respect of the consideration
Please contact Corporate Nominee Facility, EQUINITI, via telephone or in writing as follows:
Telephone (Shareholder Helpline)
0330-123-5506 (+44-121-415-0856 if calling from outside the UK)
A text phone is also available on:
0371-384-2255 (+44-121-415-7028 if calling from outside the UK) Lines open 8.30am to 5.30pm (UK time), Monday to Friday (excluding public holidays in England and Wales).
In writing
The Manager, Equiniti Corporate Nominees Limited, Aspect House, Spencer Road, Lancing, West Sussex, BN99 6DA United Kingdom
Or you can send us your query securely by completing the online form at: help.shareview.co.uk
In accordance with the Scheme of Arrangement Corporate Nominee Facility will end two (2) years from the Scheme Effective Date (January 8, 2019). After such time, any remaining shares will be sold and a Sterling cheque issued. Learn more
Have any questions?
Find a list of frequently asked questions specific to Investor Relations, or reach out to us through contact information.